
You’ve been with us through “Product Research 101” and “Product Research 201,” so we know you have a heap of high-quality data just waiting to be used. But what happens next? “Product Research 301: An Advanced Guide to Analyzing & Employing Data,” tells you everything you need to know about how to analyze your data to inform and de-risk a decision — which is the whole reason you started doing research in the first place.
Assuming your data is clean and ready to go, the question we’ve all been waiting to answer is: What insights can you glean from your data to drive your decisions?
Try to find the story in your data. Your story may show that your respondents like a certain feature or prefer a particular message. Does every group of people feel this way? Do males feel the same as females? Do all age ranges agree? All geographies?
At this point, reviewing audience segments and sub-sections can help you gain specific insights.

CX platforms usually have such functionality built in. DISQO, for example, lets you cut your data, so you can review results by a specific variable. Data cuts let you cut responses to questions by default demographic groups, as well as by all closed-end survey questions. This is a great way to quickly find any interesting trends or differences. Data cuts are an incredibly useful tool for finding the story behind your data.
DISQO Experience Suite also offers “Automated Insights” to help you automatically identify trends among certain populations in an effort to inform the next steps. These insights highlight statistical differences across cohorts and quickly point you to where to look first when viewing your results, where to dive deeper, and even to surface insights you may not have come to on your own. See examples of Automated Insights below.
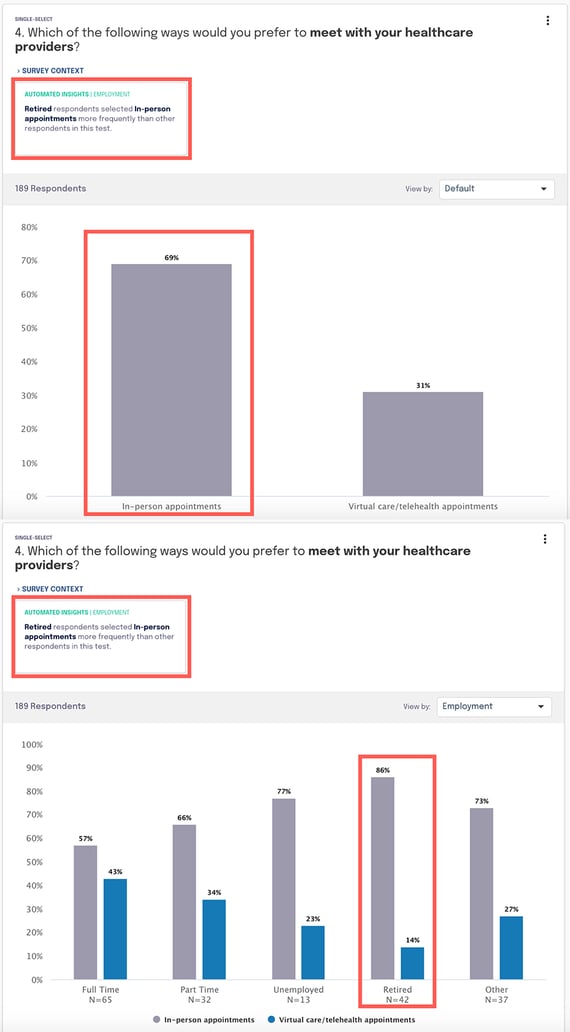
Automated Insights provide several high-level benefits:
- Speed-to-insight: When Automated Insights surface patterns without any manual work, users save time and get interesting results more quickly.
- Speed-to-iteration: When Automated Insights highlight unexpected behavior, users can explore reasons for these responses using follow-up tests.
Some platforms, including DISQO, allow you to create charts and graphs and import them directly into PowerPoint presentations, so you can create and share your data story with other stakeholders. With this much meaningful help available through automated platforms, why, oh why would you ever try to conduct research without one?
For additional support on what to do with all your data once you have it — including how to maximize actionability to inform your decisions — download “Product Research 301: An Advanced Guide to Analyzing & Employing Data.”
.png?width=352&name=Where%2c%20why%20and%20when%20(1).png)

